Container port performance deteriorates following post-pandemic recovery
World Bank’s analysis finds geopolitical instability, supply chain disruptions and shipping schedule reliability erosion undermining container port efficiency gains
The latest container port performance reviews are in, and the key question for Canada’s players is: Do we have the right stuff to audition for a leading role on the world stage?
Casting director’s response: Don’t call us, we’ll call you.
If we’re lucky, perhaps a bit part here and there, according to the World Bank’s 2025 Container Port Performance Index (CPPI) rankings.
Ditto other North American port performers.
None currently holds a candle to the real star on that CPPI stage.
Asia has been in the CPPI spotlight ever since the World Bank’s Transport Global Practice, along with S&P Global Market Intelligence, launched the CPPI in 2020 to measure container port performance and provide a diagnostic and planning tool for container ports.
Now in its fifth iteration, the CPPI, which measures the time a container ship spends in any given port, has become a global benchmark for container port efficiency.
The news on that measurement for North America is not great.
2025’s CPPI results, based on 2024 data from 403 major global ports, 175,000 vessel calls, and 247 million container moves, mirror many of the findings in the World Bank’s previous CPPI. As noted in The Substack Shipping News, no North American port was even in the top 50 of the 405 ports included in the 2024 CPPI report.
And North America’s West Coast has retained its CPPI cellar-dweller status
This time around, the continent manages to break into the top 30 courtesy of Philadelphia (No. 26). The best North America could do in the previous CPPI was No. 53 (Charleston).
Asia dominates the CPPI’s top 20. Ten of the 20 are in China, including Yangshan (No. 1), Fughou (No. 2) and Dalian (No. 4). Despite the ongoing Red Sea crisis, four ports from the Middle East and North Africa are in the top 20.
Algeciras (No. 20) is the West’s sole top 20 finisher.
And North America’s West Coast has retained its CPPI cellar-dweller status.

Vancouver slipped to No. 389 from No. 356 in last year’s CPPI rankings after its overall index score dropped to minus-159 in 2024 from minus-35 in 2023.
The port’s ranking this year leaves it trailing nearby transpacific competitor Seattle (No. 271) but ahead of Tacoma (No. 394).
California heavyweights Long Beach (No. 318) and Los Angeles (No. 359) leapfrogged Vancouver after improving from their respective No. 373 and No. 375 showings last year.
Prince Rupert (No. 362) provided Canada’s West Coast with some light in the CPPI basement. The north coast port is on the list of the top 20 most improved ports between 2023 and 2024 after increasing its CPPI score to minus-54 in 2024 from minus-188 in 2023.
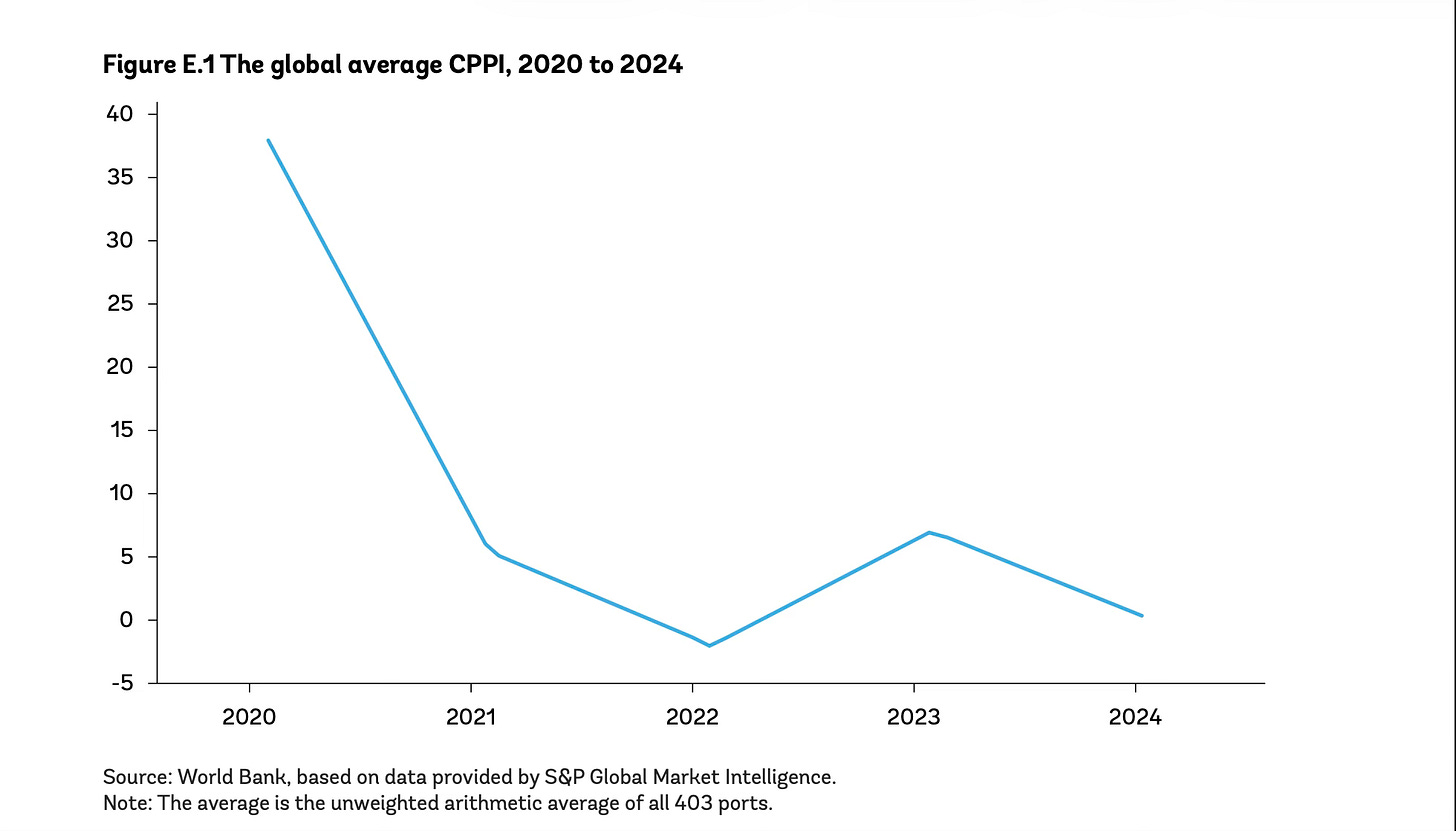
Overall, according to the World Bank, global container port performance has eroded between 2020 and 2024 and given up 2023’s gains “due to the Red Sea Crisis, challenges at the Panama Canal, and pandemic-related shocks.”
2025’s chaotic trade and tariff marketplace has multiplied port performance challenges in all regions.
That is not to excuse the continued subpar CPPI rankings for North American ports.
They all need to do better.
Public-private investment in infrastructure, technology, terminal operating systems and strategic automation implementation will be critical to that improvement.
Cultivating the environment that attracts investment should be atop Prime Minister Mark Carney’s “nation-building” agenda.
His recently announced Contrecœur Terminal Container Project for the Port of Montreal is a start. However, Montreal’s current container handling capacity is around 2.1 million 20-foot-equivalent units (TEUs), and its annual throughput ranges between 1.3 million and 1.7 million TEUs. A 60% expansion of Montreal’s container capacity might be politically expedient, but where is the demand data to justify making that investment a priority in a port with a relatively shallow harbour?
As illustrated by the CPPI rankings and the DynaLiners Millionaires report on the world’s top container handling countries, the West Coast and the country’s vital Asia-Pacific Gateway need all the infrastructure and technology improvement investment they can get.
With 90% of the $4.6 billion in Canada’s National Trade Corridors Fund already awarded and the 17 Canadian Port Authorities that oversee Canada’s port operations needing between $15 billion and $21.5 billion for critical capital projects over the next decade, where is that investment going to come from?
Canada needs to start thinking strategically rather than politically when it comes to prioritizing the allocation of nation-building projects.
And the country’s port performance needs dynamic direction if it is to graduate to the main stage.
Today, we are getting B-movie direction at best.
www.linkedin.com/in/timothyrenshaw
@trenshaw24.bsky.social
@timothyrenshaw

