
Tariff torpedoes on course to scuttle North American container cargo business buoyancy
Rising tide of freight flow analysis delivers forecasts of a radically redrawn map of global goods movement and continued weakening of North American dominance in East-West trade

More maritime shipping data, more container cargo deceleration clouds heading North America’s way.
Big picture stuff to start – this time, courtesy of the United Nations Conference on Trade and Development’s (UNCTAD) 2025 Review of Maritime Transport.
The watchword on the high seas in 2025: turbulence.
Or in the words of UNCTAD’s Secretary-General Rebeca Grynspan, “sustained disruption to the arteries of global commerce” not seen since “the closure of the Suez Canal in 1967.”
Red alert, indeed.
So, it’s not surprising that the disruptions detailed in the UNCTAD report are catching up to the shipping business in 2025’s latter half. The September 21 Substack Shipping News report chronicles the projected impact this year and next on container terminals, while the publication’s September 10 analysis looks at the fallout for major ocean carrier companies.
UNCTAD’s marine transportation overview provides overall global insights.
For example, the sustained disruption that the organization’s secretary-general alludes to has added thousands of shipping miles to supply chains seeking vessel diversions away from geopolitical conflict zones. The result: average voyage haul has increased 8.6% to 5,245 miles in 2024 from 4,831 in 2018.
Longer voyages make supply chains less efficient and more vulnerable to disruption. That multiplies shipping costs.
Overall, seaborne trade in ton-miles logged by the world’s 112,500-vessel commercial fleet jumped 6.1% in 2024 from 2023, while maritime trade flow increased 2.2%.
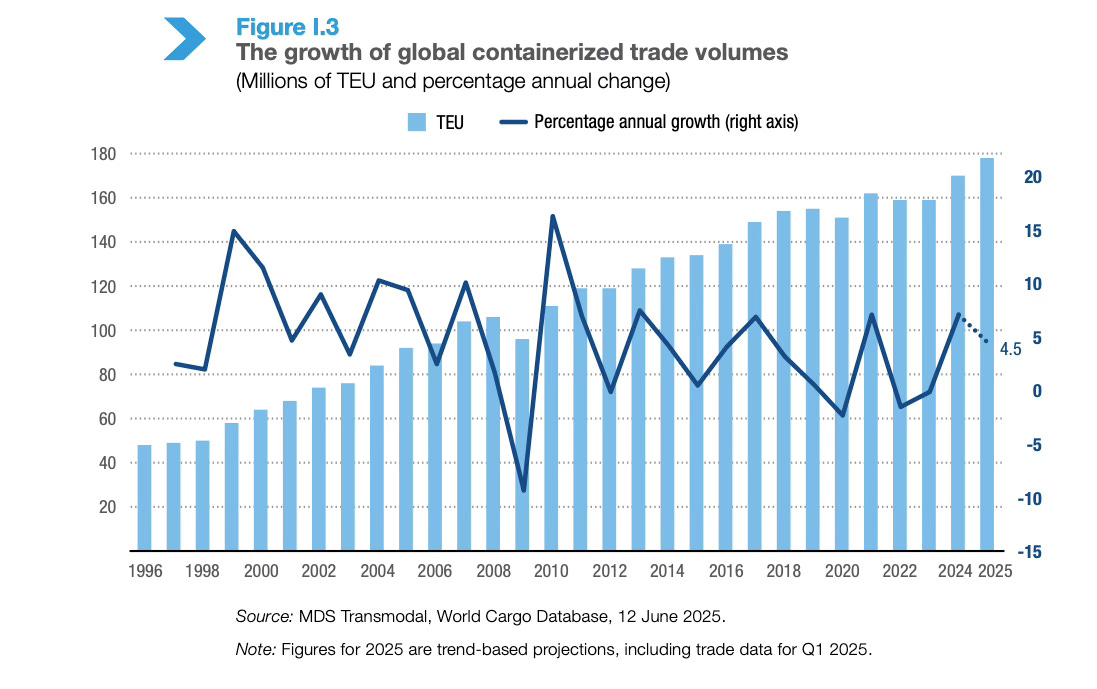
But UNCTAD has downgraded its 2025 maritime trade flow growth forecast to a 0.5% trickle from its earlier 1.4% outlook, while projecting global container trade to increase 1.4%.
It sees things brightening slightly in the medium term, with total annual seaborne trade growth averaging 2% between 2026 and 2030 and annual containerized trade growth averaging 2.3% during the same period.
“The U.S. is a less relevant player in world trade today than it was prior to these various tariff initiatives and will become more so as announced plans are implemented.”
– John McCown, container shipping analyst, The McCown Report
In the here-and-now, recent data from New York-based container shipping analyst John McCown shows a drop in Asia-North America Q3 2025 container cargo flow.
Inbound container traffic through the top 10 U.S. ports inched up 0.1% in August compared with the same month a year ago.
Exports were down 2.6%.
McCown noted that the import increases in August and July (up 3.2%) represented a “slight bounce back … driven by frontloading to get goods in prior to additional tariffs going into effect in August.”
The Port of Vancouver benefited from that bounce-back. Its mid-year cargo statistics show container traffic up 6% to 1.88 million TEUs in 2025’s first six months compared with the same period in 2024. Overall cargo handled by the port increased 13%.
But McCown pointed out that the August and July downbound market reprieve for U.S. ports “came after decreases of 8.3% in June and 6.6% in May.”
The McCown Report data also illustrates the widening gap between North America’s decelerating container cargo flow and the accelerating flow elsewhere in the world.
For example, McCown noted that July’s Far East container exports “set a new record and were 6.3% ahead of the same month last year. In contrast, in the absence of the frontloading that spiked inbound volume into the U.S., we would have seen July come in at a negative number at least as high as the Far East’s positive number.”
That shift in container flow, he said, shows how U.S. tariffs are reconfiguring supply chains and trading patterns.
The long-term result, McCown warned, is American trading muscle atrophy.
“The U.S. is a less relevant player in world trade today than it was prior to these various tariff initiatives,” he said, “and will become more so as announced plans are implemented.”
Drewry’s latest World Container Index (WCI) agrees.
As of September 25, the composite index of freight rates on eight major maritime trade lanes had dropped by 8% to US$1,761 per 40-foot container. The decrease, according to Drewry, marks the 15th consecutive week of rate declines on major Asia-Europe and Asia-North America trade routes.
The U.K.-based shipping consultancy has also reported that a combination of oversupply, weak demand and increased container port congestion has driven a September-October spike in container shipping lines blanking (withdrawing) sailings.
Half of those blanked services, according to Drewry, are on transpacific trade lanes.
It expects spot freight rates to continue to decline as container shipping’s supply-demand balance weakens over the next few quarters.
McCown, a critic of the U.S. administration’s tariff campaign, maintains that a 25% tariff-driven drop in container volume into the U.S. is “readily possible.”
He estimated that the decline would reduce annual commerce in the U.S. by US$578 billion.
The Office of the United States Trade Representative (USTR) levies on all Chinese-made ships docking at U.S. ports, scheduled to start on October 14, will impose another layer of trade penalties on North American businesses and consumers.
Placing the tariff and USTR impacts on a commerce and inflation spectrum, McCown said, “The more one, the less the other and vice versa. The more inbound container volume to the U.S. declines, the more commerce and growth will be impacted, but the less inflation we will get. The less inbound container volume to the U.S. declines, the more inflation we will get, but the less commerce and growth will be impacted. Unfortunately, there is simply no good place to be on that spectrum.”
Small wonder then that ocean carriers are seeking ways to navigate around that spectrum entirely.
www.linkedin.com/in/timothyrenshaw
@trenshaw24.bsky.social
@timothyrenshaw